
Balance sheet and Income statement
Cashfulness gives you the two classic double-entry reports. The Balance sheet is a snapshot of your situation at a specific date: what you own, what you owe, and the resulting Net worth. The Income statement tells the story of a period instead: how much Revenue you earned, how much Cost you incurred, and the profit that came out of it. In this chapter you will learn how to read them, explore them in depth, and export them as PDF.
The Balance sheet: a snapshot of your wealth
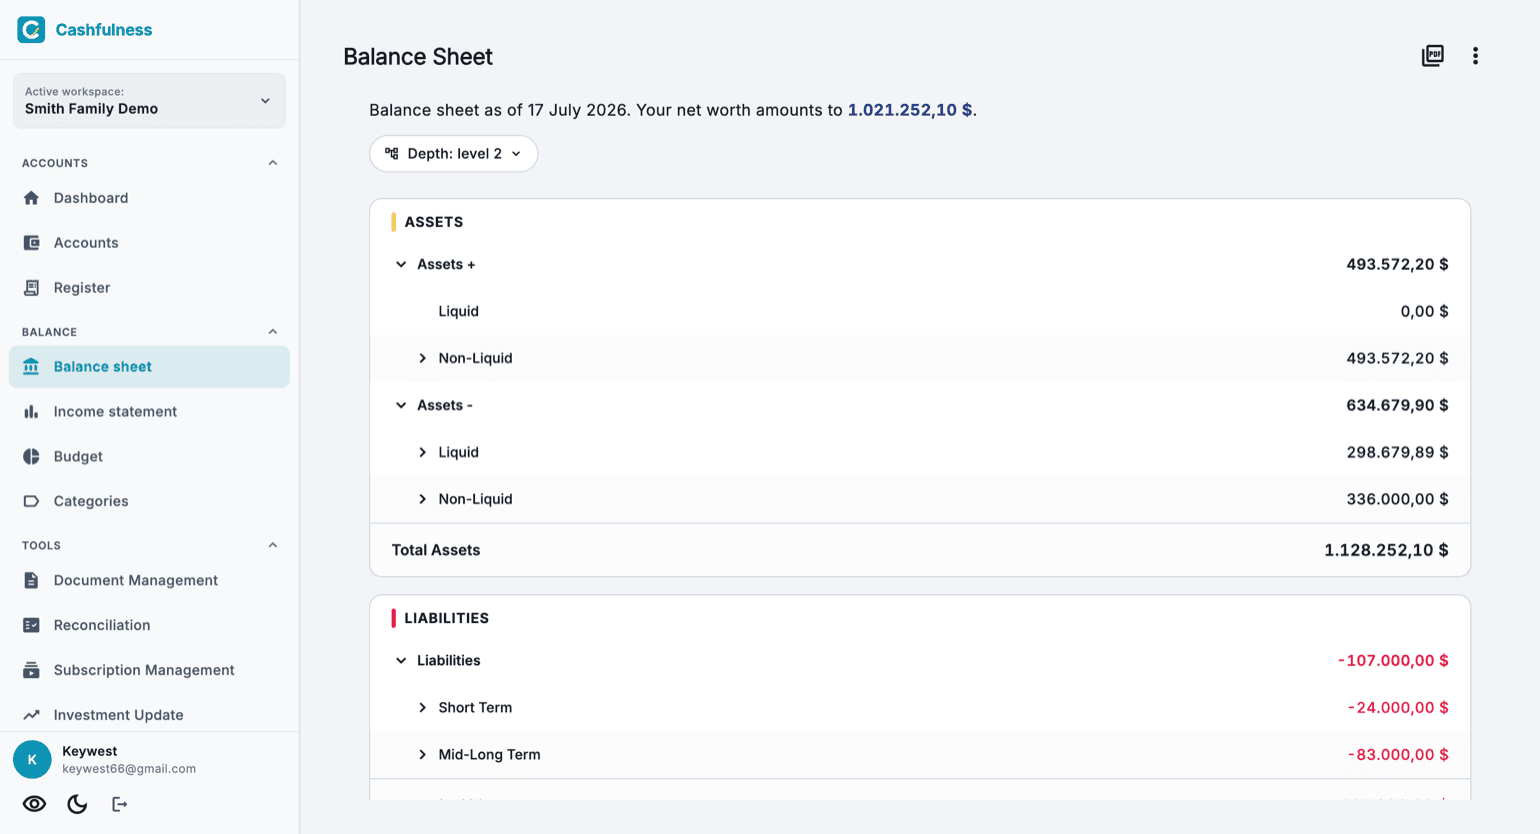
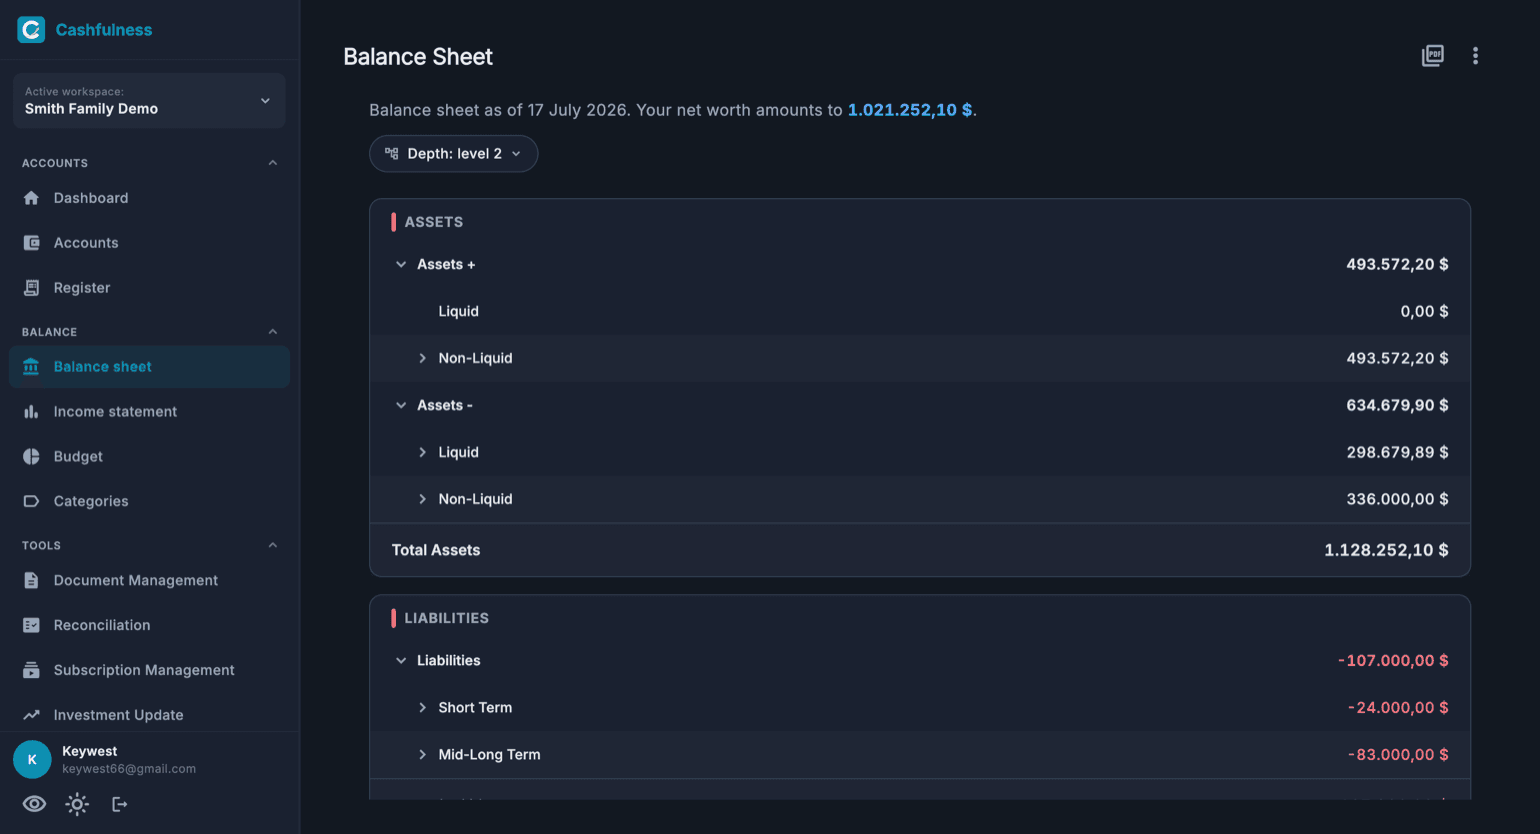
The Balance sheet shows, at the selected date, what you own (Assets), what you owe (Liabilities), and the difference between the two: your Net worth. At the top of the page, a single sentence sums up the number that matters most, your net wealth, highlighted in blue.
Assets are grouped according to the structure of your accounts, with a subtotal for each group and a Total Assets line closing the section. Liabilities follow the same layout and end with Total Liabilities. Liability amounts appear with a negative sign: this is the double-entry convention, where credit balances reduce your wealth.
Exploring the figures: depth and drill-down
Every row with a side arrow can be expanded to reveal the groups and accounts behind it. The Depth selector at the top controls how many levels of the hierarchy are visible by default: a low level gives you the big picture, a higher level shows the account-by-account detail.
Drill-down works the same way in both reports, so you can move between the Balance sheet and the Income statement without changing your reading habits.
The Income statement: the story of the period
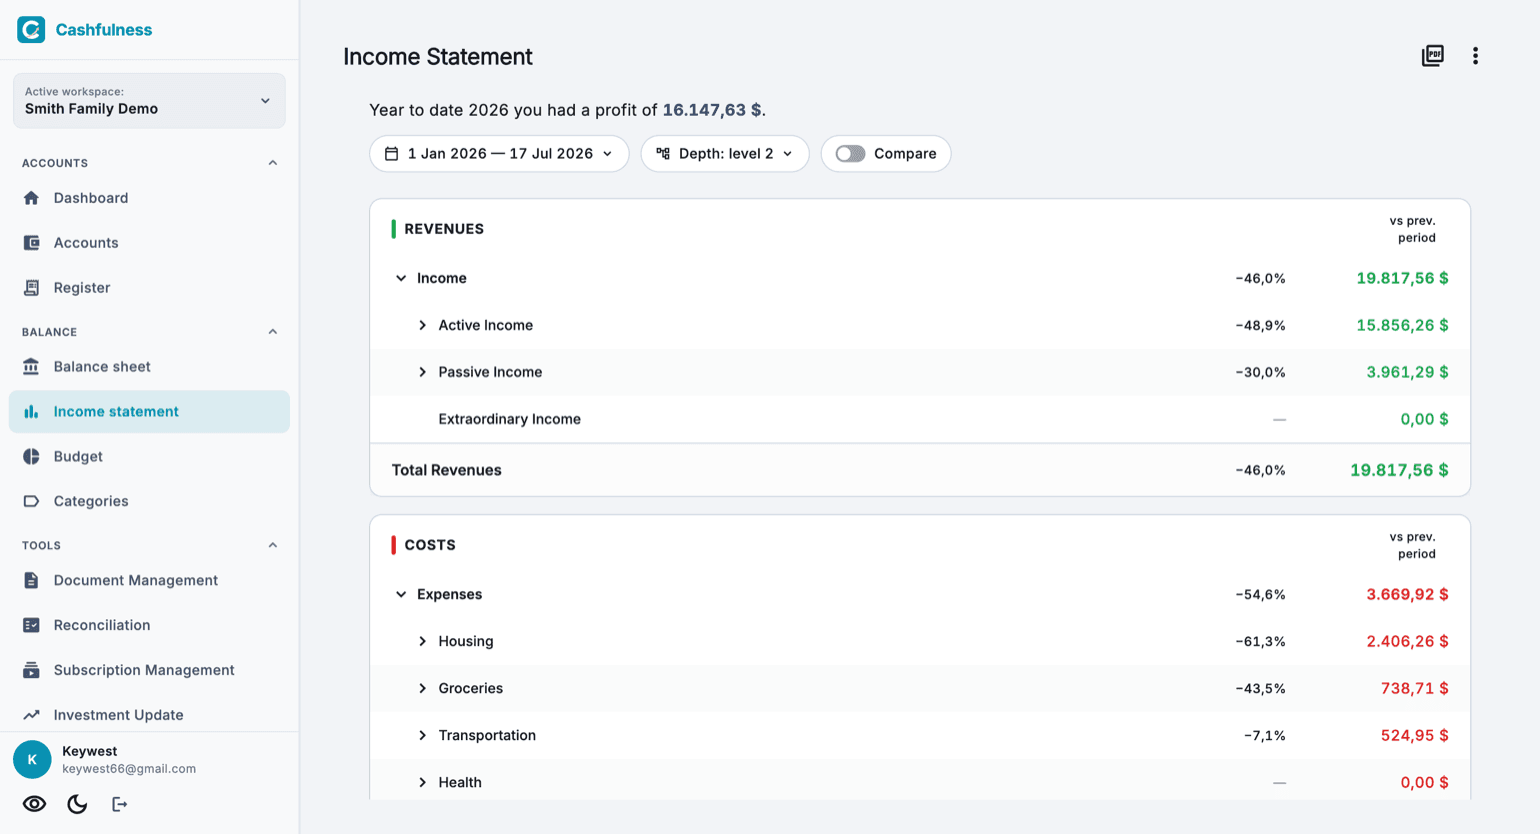
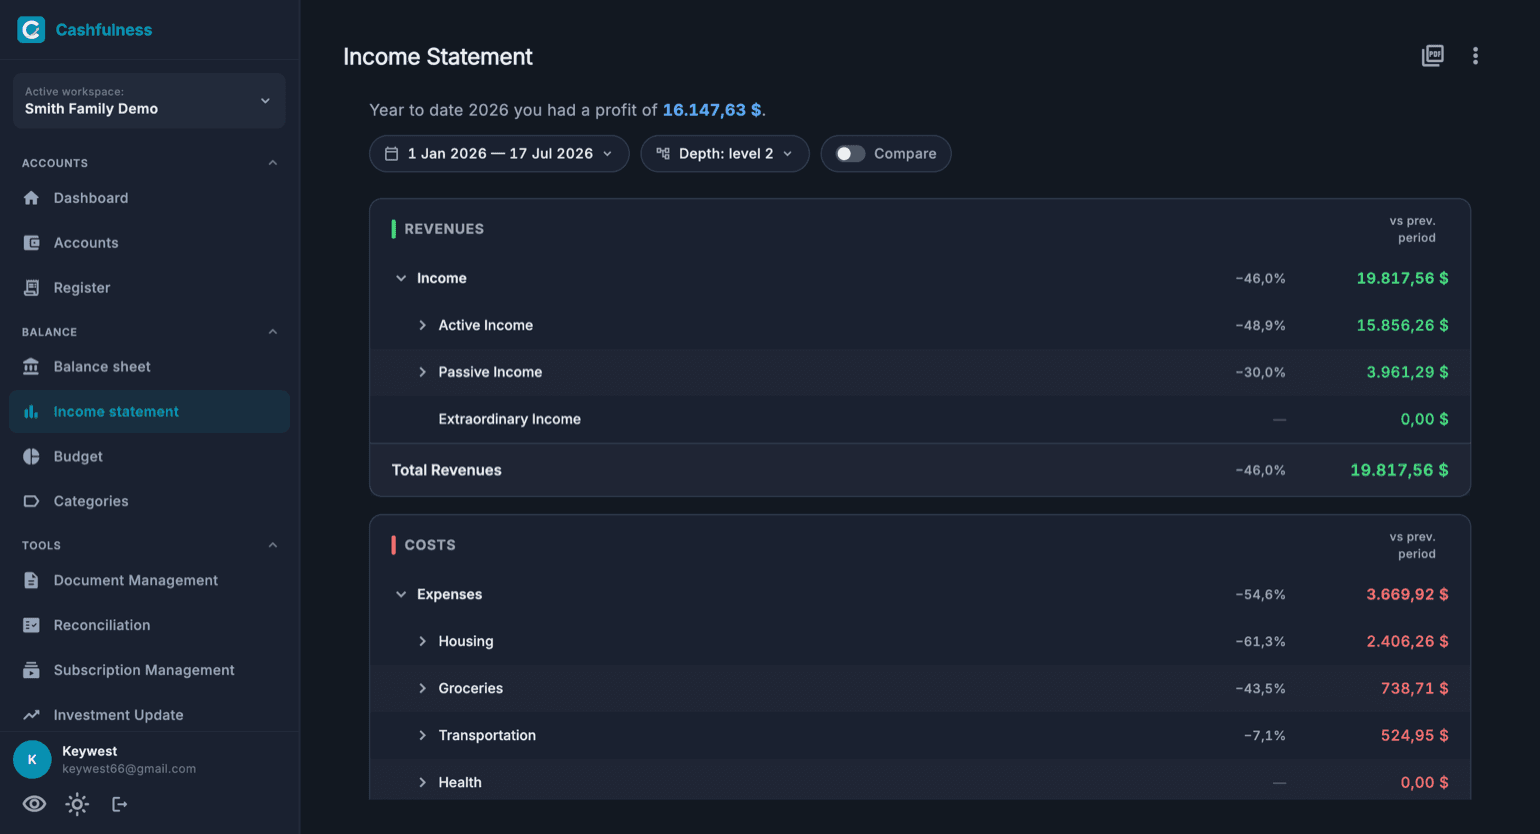
The Income statement answers a different question: how did a given period go? It adds up Revenues, subtracts Costs, and shows the result, your profit, highlighted in blue in the sentence at the top of the page.
The period selector at the top lets you choose the range to analyze, for example the current year. Next to the amounts you will find a comparison column against the previous period, expressed as a percentage: at a glance you can see which items grew and which shrank. There is also a Comparative toggle for the period-comparison view.
Revenues are shown in green and Costs in red, so the nature of each line stays clear even when you skim through the report.
Reading the two reports together
The two reports are connected: the profit from the Income statement feeds the Net worth on the Balance sheet. If Revenues exceed Costs over a period, the difference increases your net wealth; if the opposite happens, it decreases it.
A good reading routine: open the Income statement first to understand how the period is going, then the Balance sheet to see the cumulative effect on your wealth.
The other reports
Besides the two classic reports, the Reports item in the menu, in the Balance section, opens a page that gathers them all. At the top you find the Cruising range: if your income stopped completely, how long you could keep going on the cash you have now, without changing your standard of living.
Below are the report cards. Costs shows where the money goes, account by account and over time, with the yearly total of your subscriptions. Net worth over time follows the course of your net worth, month by month. Income and expenses tells you how much comes in and goes out each month, with the averages. Projected balance shows where your cash will be in the coming weeks, counting the recurring items already scheduled.
Revaluations and depreciation shows how much the value of what you own has changed without any money coming in or going out: depreciation and revaluations of durable assets, and investment valuations made from Tools → Investment Update, grouped by account.
Exporting to PDF
Both reports can be exported as PDF, handy for archiving them at year end or sharing them with whoever helps you with financial decisions.
- Open the Balance sheet or the Income statement.
- Set the depth and, for the Income statement, the period you want to export.
- Tap the PDF icon in the top-right corner, then save or share the generated document.