
The Dashboard
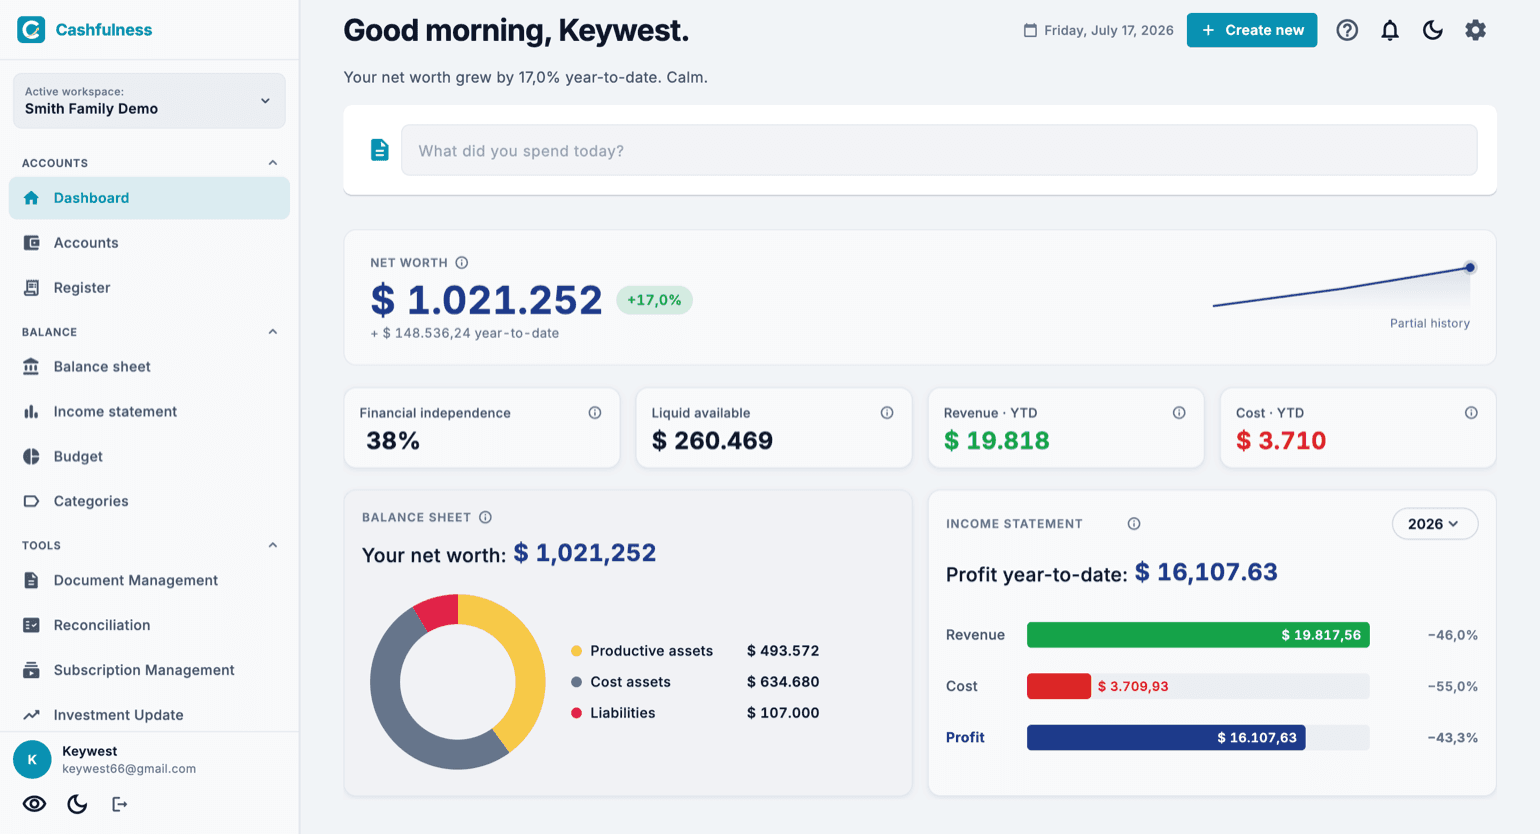
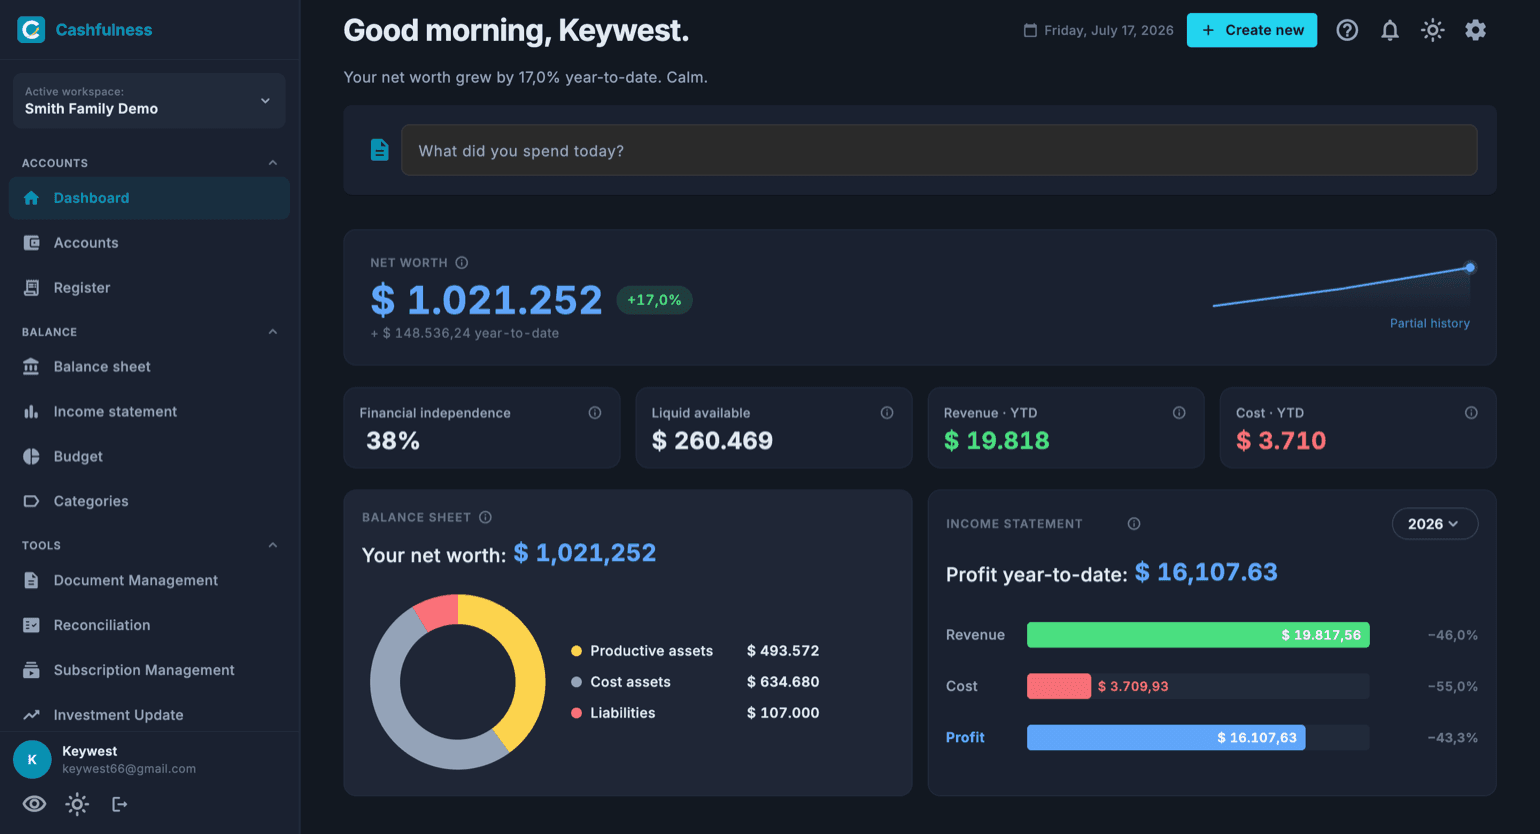
The Dashboard is the first screen you see when you open Cashfulness. At a single glance it tells you how your wealth is doing: a personal greeting, a plain-language summary of the year-to-date trend, the key indicators, and the two cards that summarise the Balance Sheet and Income Statement of the active workspace.
A snapshot of your wealth
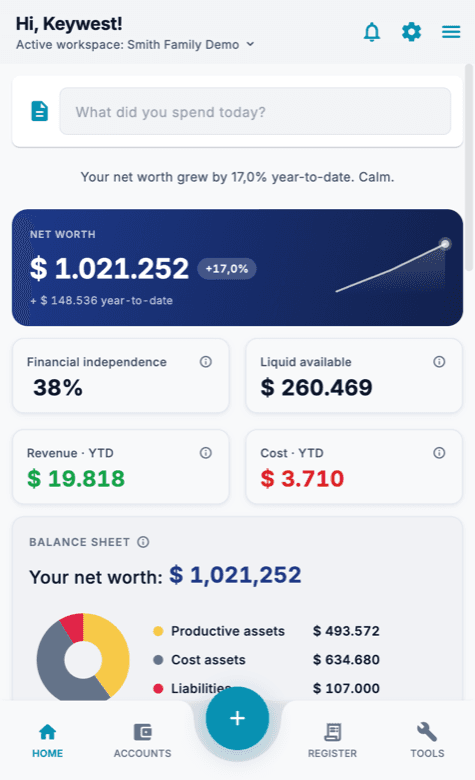
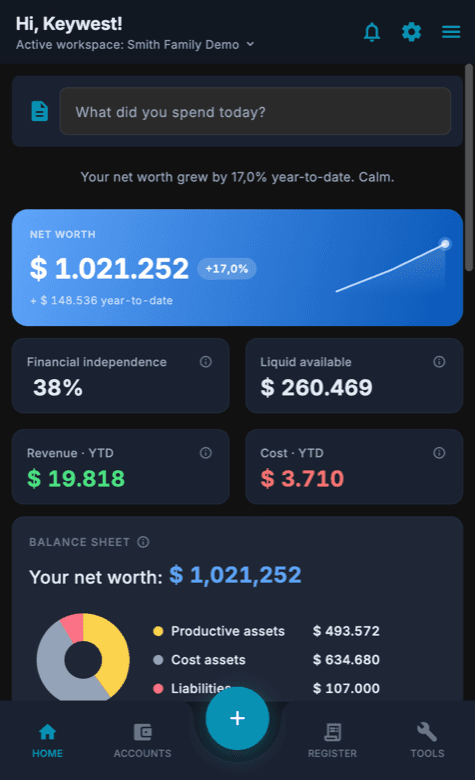
At the top of the Dashboard you find a greeting with your name and, right below it, a sentence that sums up your wealth in plain words: for example whether it has been stable, growing or declining since the start of the year.
Everything on the Dashboard refers to the active workspace, shown in the sidebar on desktop and in the header on mobile. If you work with several workspaces, switch workspace to see the snapshot of the one you are interested in.
Quick entry: What did you spend on today?
Below the greeting sits the quick entry bar, asking What did you spend on today?. It is the fastest way to record an expense you have made before: write what you spent on, and Cashfulness suggests the similar transactions you have already recorded.
- Tap the What did you spend on today? bar and type a word or two about the expense, for example supermarket. No need for the amount: the bar only searches descriptions and notes.
- Pick the right similar transaction: Cashfulness brings it back pre-filled, with accounts and debit and credit amounts. If nothing matches, you can enter the transaction from scratch.
- Review the proposal and confirm it: only after your confirmation is the transaction recorded in the Register.
Net worth and key indicators
The Net worth card shows the overall value of your wealth in blue, the change since the start of the year (as a value and as a percentage) and a mini chart with the recent history.
The change since the start of the year almost never matches the profit in the Income statement, and that is not an error. It starts from the year's first snapshot, so the days before it stay out, and it also includes currency movements, which never appear in the Income statement because they are not transactions.
Below it you find four indicators. Financial independence is the percentage of your wealth invested in productive assets. Available liquidity shows how much money is immediately spendable. Revenue YTD, in green, and Costs YTD, in red, summarise income and expenses since the start of the year.
Balance Sheet and Income Statement at a glance
The Balance Sheet card summarises your net wealth with a donut chart: productive assets (Assets+) in gold, other assets (Assets-) in grey, liabilities in pink. Next to the chart you see the value of each component.
The Income Statement card shows the year-to-date profit and three horizontal bars: Revenue in green, Costs in red and Profit in blue, with a comparison against the previous period.
Both cards are summaries: for the full analysis open the Balance Sheet and Income Statement sections from the menu.
The language of colours
In Cashfulness colours are not decorative: they are a consistent language across the whole app. Blue stands for wealth and profit, green for revenue, red for costs, gold for productive assets.
Once you have learned this map, you can read any screen at a glance: if a number is green you are looking at revenue, if it is red at a cost, if it is blue at a measure of your wealth.